Solar System Example
In this file we are going to show you how you can use the Cloud Office Print SDK to generate an output file using a template and data to fill the template. The general approach is to create a template file in which you want the data to appear, then process the data with this SDK and finally let Cloud Office Print do the work to merge your template with the data.
In this example, we are going to use solar system data to fill a template we are going to make. The solar system data can be received by sending an HTTP-request to an API. The API used in this example is https://api.le-systeme-solaire.net.
Normally you know the data you will be using to fill in the template, but for this example, we are going to start with a brief overview of the data we will be using. Then we will create a template. Then we will get the data from the solar system API and process this data with this SDK. Finally we send the template together with the data to a Cloud Office Print server and save the response into our output file.
Input Data (API)
The data we use comes from https://api.le-systeme-solaire.net. The data that interests us is about the bodies of the solar system and more specifically the planets and dwarf planets in our solar system. If we go to the URL https://api.le-systeme-solaire.net/rest/bodies, we retrieve a JSON array containing objects for each body in the solar system. One such object may look like this:
{
    "id": "lune",
    "name": "La Lune",
    "englishName": "Moon",
    "isPlanet": false,
    "moons": null,
    "semimajorAxis": 384400,
    "perihelion": 363300,
    "aphelion": 405500,
    "eccentricity": 0.0549,
    "inclination": 5.145,
    "mass": {
        "massValue": 7.346,
        "massExponent": 22
    },
    "vol": {
        "volValue": 2.1968,
        "volExponent": 10
    },
    "density": 3.344,
    "gravity": 1.62,
    "escape": 2380.0,
    "meanRadius": 33.0,
    "equaRadius": 1738.1,
    "polarRadius": 1736.0,
    "flattening": 0.0012,
    "dimension": "",
    "sideralOrbit": 27.3217,
    "sideralRotation": 655.728,
    "aroundPlanet": {
        "planet": "terre",
        "rel": "https://api.le-systeme-solaire.net/rest/bodies/terre"
    },
    "discoveredBy": "",
    "discoveryDate": "",
    "alternativeName": "",
    "axialTilt": 6.68,
    "avgTemp": 0,
    "mainAnomaly": 0.0,
    "argPeriapsis": 0.0,
    "longAscNode": 0.0,
    "rel": "https://api.le-systeme-solaire.net/rest/bodies/lune"
}
Template
Now we will build the template. We can create templates in different file extensions, namely docx, xlsx, pptx, html, md, txt and csv. In this example we will build a template of filetype pptx and docx. The template has to follow a specific structure which can be found at the official Cloud Office Print documentation: https://www.cloudofficeprint.com/docs/.
pptx
We will build the template in Google Slides. After choosing a pretty theme, we create the title slide. On this slide, we want the title of our presentation and the source where we got the data from. The title slide looks like this:
Here we encounter our first placeholder/tag: {*data source}. Tags are defined by surrounding a variable name with curly brackets. This is the way we let the Cloud Office Print server know that data needs to replace this placeholder. We will see what that data is in the section Process input data. In this specific case, we used a hyperlink-tag {*hyperlink}.
Note: to minimize the modifications to the input data (see Input Data (API)), it is important to use as variable names the keys available in the input data if possible.
Next, we want to have a slide for each planet with information about this planet. Since all planets have the same parameters (such as mass, density, gravity etc.), we want to specify one template slide and use this for each planet. This template slide looks like this:
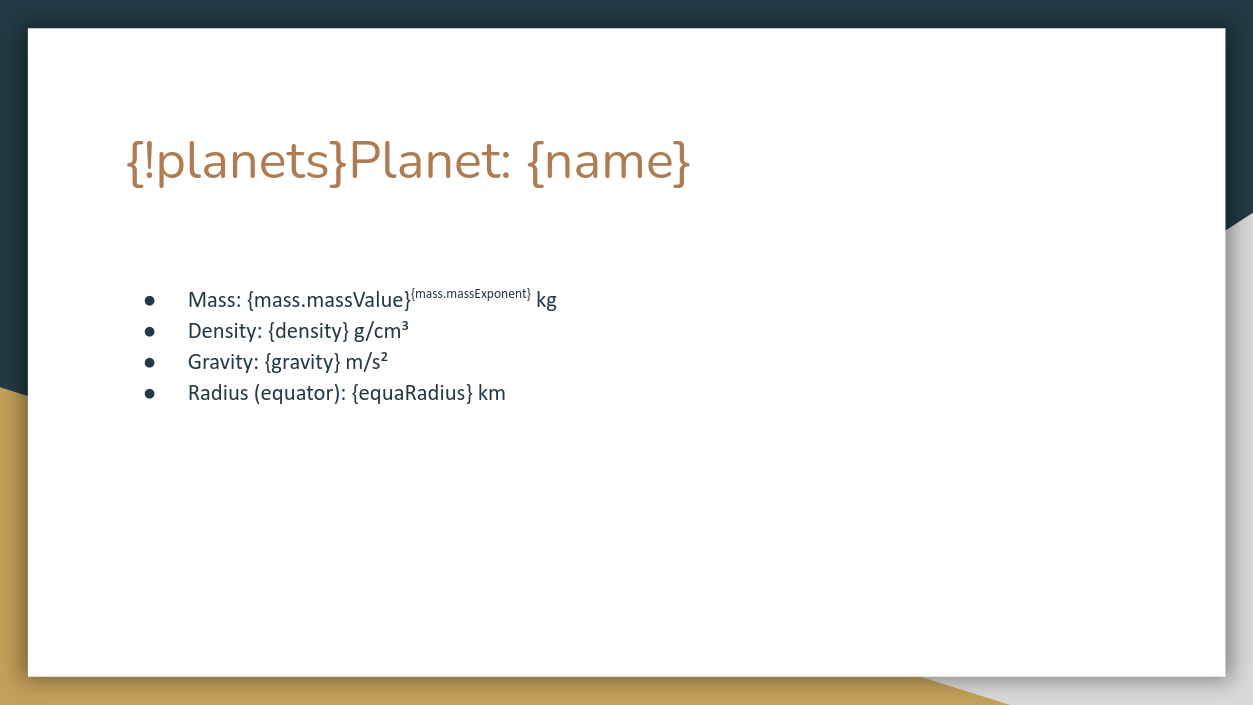
Again, the placeholders will be replaced with data by the Cloud Office Print server. Since the data given to the Cloud Office Print server will be in JSON-format (see Process input data), it is possible to reach a subfield of an entry by using entry.subfield. So if mass is a JSON object like this:
"mass": {
  "massValue": ...,
  "massExponent": ...
}
we can access the field massValue by doing mass.massValue, as can be seen on the slide. The tags on this slide are 'normal' tags in the sense that they will just be replaced by a value.
The thing of replicating a certain template slide for each object in a list is exactly what the first tag {!planets} is for. For each planet in the planets-array (provided in the data, see Process input data), this slide is repeated.
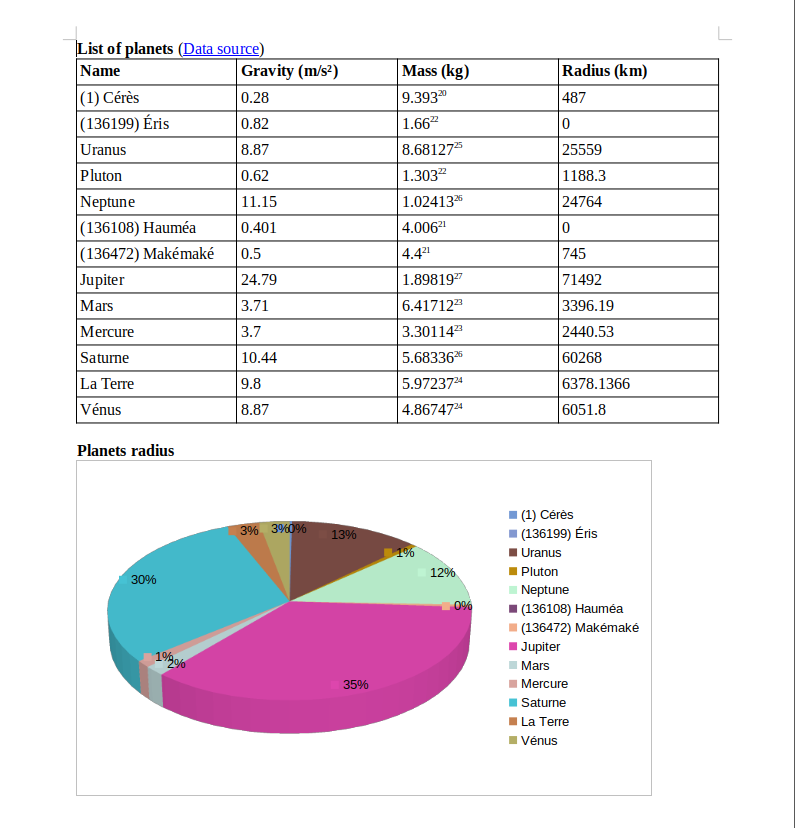
It might be interesting to plot the radius for each of the planets on a chart. This is the slide used for that:
The tag {$planet_radius_chart} is used to insert a chart at the place of this placeholder. The data for the chart can be generated using the SDK.
docx
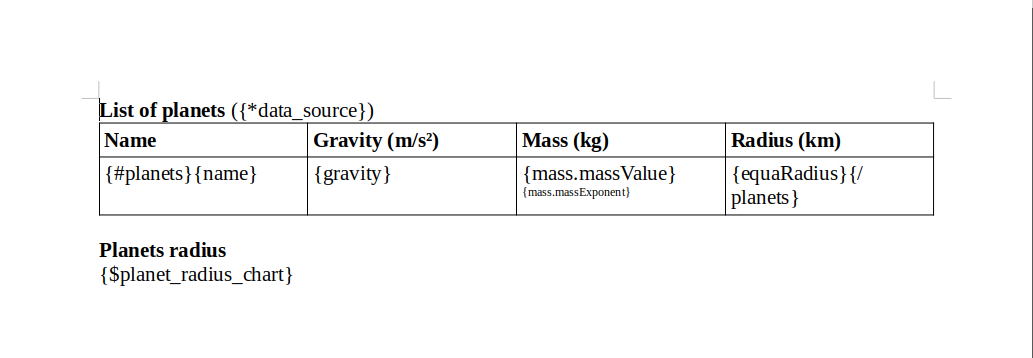
The template for the "docx"-filetype is very similar to the template for the "pptx"-filetype in the sense that they use the same parameters. For this template we want to generate a table containing information about the planets in the solar system. The template looks like this:
Process Data (SDK)
Now that our template is finished, we have to process the data used by the template. That is where the SDK comes into play. In this section we will explain in detail all the code needed to generate the data to fill in the template. The full code can also be found in the example file itself.
The beauty of Cloud Office Print is that the data created by the SDK can be used in all templates of different file extensions while using the same tags.
Setup
First we create a new file and import the Cloud Office Print library:
import cloudofficeprint as cop
const cop = require('cloudofficeprint');
import * as cop from 'cloudofficeprint';
import com.CloudOfficePrint.*;
We also need to import the appropriate library for fetching data from the API:
import requests
const fetch = require('node-fetch');
import fetch from 'node-fetch';
// Part of com.CloudOfficePrint.Server.Server
Then we need to set up the Cloud Office Print server where we will send our template and data to: Then we need to set up the Cloud Office Print server where we will send our template and data to:
SERVER_URL = "https://api.cloudofficeprint.com/"
API_KEY = "YOUR_API_KEY"  # Replace by your own API key

server = cop.config.Server(
    SERVER_URL,
    cop.config.ServerConfig(api_key=API_KEY),
)
const SERVER_URL = 'https://api.cloudofficeprint.com/';
const API_KEY = 'YOUR_API_KEY'; // Replace by your own API key

const server = new cop.config.Server(
    SERVER_URL,
    new cop.config.ServerConfig(API_KEY),
);
const SERVER_URL = 'https://api.cloudofficeprint.com/';
const API_KEY = 'YOUR_API_KEY'; // Replace by your own API key

const server = new cop.config.Server(
    SERVER_URL,
    new cop.config.ServerConfig(API_KEY),
);
Server copServer = new Server("https://api.cloudofficeprint.com/");
copServer.setVerbose(true); //This sets the verbose mode on.
copServer.setAPIKey(APIKey);
If you have a Cloud Office Print server running on localhost (e.g. on-premise version), replace the server url by the localhost url: http://localhost:8010
We also need to create the main element-collection object that contains all our data:
data = cop.elements.ElementCollection()
const data = new cop.elements.ElementCollection();
const data = new cop.elements.ElementCollection();
ElementCollection spaceXData = new ElementCollection("data");
Import Data
As discussed in Input data (API), we use an API of a cloud server to receive the data about the planets. The information we use for this example can be received as follows:
res = requests.get("https://api.le-systeme-solaire.net/rest/bodies/")
json = res.json()
(async () => {
    const res = await fetch('https://api.le-systeme-solaire.net/rest/bodies/');
    const json = await res.json();
})();
(async () => {
    const res = await fetch('https://api.le-systeme-solaire.net/rest/bodies/');
    const json = await res.json();
})();
Server server = new Server("https://api.le-systeme-solaire.net/rest/bodies/");
String response = server.sendGETRequest(server.getUrl());
JsonObject parsed = JsonParser.parseString(response).getAsJsonObject();
Title Slide
The template title slide contains a normal tag for the title {main_title} and a hyperlink-tag {*data_source}. Now we need to add the data for these tags in our code by creating a Cloud Office Print element (property and hyperlink) and adding this to the main data collection:
main_title = cop.elements.Property("main_title", "The solar system")
data.add(main_title)

data_source = cop.elements.Hyperlink(
    name="data_source",
    url="https://api.le-systeme-solaire.net/rest/bodies/",
    text="Data source",
)
data.add(data_source)
const mainTitle = new cop.elements.Property('main_title', 'The solar system');
data.add(mainTitle);

const dataSource = new cop.elements.Hyperlink(
    'data_source',
    'https://api.le-systeme-solaire.net/rest/bodies/',
    'Data source',
);
data.add(dataSource);
const mainTitle = new cop.elements.Property('main_title', 'The solar system');
data.add(mainTitle);

const dataSource = new cop.elements.Hyperlink(
    'data_source',
    'https://api.le-systeme-solaire.net/rest/bodies/',
    'Data source',
);
data.add(dataSource);
data.addElement(new Property("main_title", "The solar system"));

data.addElement(new HyperLink("data_source", "Data source", "https://api.le-systeme-solaire.net/rest/bodies/"));
The tag {main_title} will be replaced by 'The solar system' and the tag {*data_source} will be replaced by the text 'Data source' and this text will have a hyperlink to the URL 'https://docs.spacexdata.com'.
Planets
The data for the planets needs to be put in a loop-element so that the Cloud Office Print server can iterate over all the planets. We also process the body-array so that we only have the bodies that are planets in our data.
planet_list = [
    cop.elements.ElementCollection.from_mapping(body)
    for body in json["bodies"]
    if body["isPlanet"]
]

planets = cop.elements.ForEach("planets", planet_list)
data.add(planets)
const planetList = json.bodies
    .filter((body) => body.isPlanet)
    .map((body) => cop.elements.ElementCollection.fromMapping(body));

const planets = new cop.elements.ForEach('planets', planetList);
data.add(planets);
const planetList: cop.elements.Element[] = json.bodies
    .filter((body: any) => body.isPlanet)
    .map((body: any) => cop.elements.ElementCollection.fromMapping(body));

const planets = new cop.elements.ForEach('planets', planetList);
data.add(planets);
JsonArray bodiesAr = parsed.getAsJsonArray("bodies");
List<ElementCollection> planetList = new ArrayList<ElementCollection>();

for (JsonElement body : bodiesAr) {
    JsonObject json = (JsonObject) body;
    if (json.get("isPlanet").getAsBoolean() == true) {
        ElementCollection coll = ElementCollection.makeCollectionFromJson("not_used", json);
        planetList.add(coll);
    }
}

Loop planets = new Loop("planets", planetList.toArray(new ElementCollection[0]));
data.addElement(planets);
Chart
Finally we need to add the data for the planet radius chart. A chart consists of one or more data series. We want the chart to be a 3D pie chart, so we first create a PieSeries with the name of the planets on the x-axis and their radius on the y-axis.
color = [None for _ in planet_list]
color[0] = "#7298d4"  # Specify the color for the first pie slice

radius_series = cop.elements.PieSeries(
    x=[planet["name"] for planet in planets.as_dict["planets"]],
    y=[planet["equaRadius"] for planet in planets.as_dict["planets"]],
    name="radius",
    colors=color,
)
const color = new Array(planetList.length);
color[0] = '#7298d4'; // Specify the color for the first pie slice

const radiusSeries = new cop.elements.PieSeries(
    planets.asDict().planets.map((planet) => planet.name),
    planets.asDict().planets.map((planet) => planet.equaRadius),
    'radius',
    color,
);
const color = new Array(planetList.length);
color[0] = '#7298d4'; // Specify the color for the first pie slice

const radiusSeries = new cop.elements.PieSeries(
    planets.asDict().planets.map((planet: any) => planet.name),
    planets.asDict().planets.map((planet: any) => planet.equaRadius),
    'radius',
    color,
);
// Add planet radius chart to data
String[] color = new String[planetList.size()];
color[0] = "#7298d4"; // Specify the color for the first pie slice

JsonObject planetsJson = planets.getJSON();
JsonArray planetsArray = (JsonArray) planetsJson.get(planets.getName());
String[] planetNames = new String[planetsArray.size()];
String[] planetRadius = new String[planetsArray.size()];

for (int i = 0; i < planetsArray.size(); i++) {
    String rawName = ((JsonObject) planetsArray.get(i)).get("name").toString();
    String rawRadius = ((JsonObject) planetsArray.get(i)).get("equaRadius").toString();
    planetNames[i] = rawName.substring(1, rawName.length() - 1);
    planetRadius[i] = rawRadius.substring(1, rawRadius.length() - 1);
}

PieSeries radiusSeries = new PieSeries("radius", planetNames, planetRadius, color);
We then create options for the pie chart. We disable the border around the chart and specify the color of the chart legend's text:
radius_chart_options = cop.elements.ChartOptions(border=False)

radius_chart_options.set_legend(style=cop.elements.ChartTextStyle(color="black"))
const radiusChartOptions = new cop.elements.ChartOptions(
    undefined,
    undefined,
    undefined,
    undefined,
    undefined,
    false,
);

radiusChartOptions.setLegend(
    undefined,
    new cop.elements.ChartTextStyle(undefined, undefined, 'black'),
);
const radiusChartOptions = new cop.elements.ChartOptions(
    undefined,
    undefined,
    undefined,
    undefined,
    undefined,
    false,
);

radiusChartOptions.setLegend(
    undefined,
    new cop.elements.ChartTextStyle(undefined, undefined, 'black'),
);
ChartOptions radiusChartOptions = new ChartOptions();
radiusChartOptions.setBorder(false);
radiusChartOptions.setLegend(null, new ChartTextStyle(null, null, "black", null));
Finally, we create the 3D pie chart itself and add it to the element collection:
radius_chart = cop.elements.Pie3DChart(
    name="planet_radius_chart",
    pies=(radius_series,),
    options=radius_chart_options,
)
data.add(radius_chart)
const radiusChart = new cop.elements.Pie3DChart(
    'planet_radius_chart',
    [radiusSeries],
    radiusChartOptions,
);
data.add(radiusChart);
const radiusChart = new cop.elements.Pie3DChart(
    'planet_radius_chart',
    [radiusSeries],
    radiusChartOptions,
);
data.add(radiusChart);
Pie3DChart radiusChart = new Pie3DChart("planet_radius_chart", radiusChartOptions, radiusSeries);
data.addElement(radiusChart);
Server and Response
Now that we have the template and the data ready, it is time to let Cloud Office Print merge them together. In the SDK this is implemented by creating a print job:
print_job = cop.PrintJob(
    data=data,
    server=server,
    template=cop.Template.from_local_file("solar_system_template.pptx"),  # pptx
    # template=cop.Resource.from_local_file("solar_system_template.docx"),  # docx
)
const printJob = new cop.PrintJob(
    data,
    server,
    cop.Template.fromLocalFile('solar_system_template.pptx'), // pptx
    // cop.Resource.fromLocalFile('solar_system_template.docx'), // docx
);
const printJob = new cop.PrintJob(
    data,
    server,
    cop.Template.fromLocalFile('solar_system_template.pptx'), // pptx
    // cop.Resource.fromLocalFile('solar_system_template.docx'), // docx
);
// Load template
Base64Resource base64Resource = new Base64Resource();
InputStream resourceAsStream;
if (templatetype == "docx") {
    resourceAsStream = getClass().getResourceAsStream("solar_system_template.docx");
} else {
    resourceAsStream = getClass().getResourceAsStream("solar_system_template.pptx");
}
byte[] targetArray = new byte[resourceAsStream.available()];
resourceAsStream.read(targetArray);
String encodedString = Base64.getEncoder().encodeToString(targetArray);
base64Resource.setFileBase64(encodedString);
if (templatetype == "docx") {
    base64Resource.setFiletype("docx");
    base64Resource.setMimeType(Mimetype.getMimeType("docx"));
} else {
    base64Resource.setFiletype("pptx");
    base64Resource.setMimeType(Mimetype.getMimeType("pptx"));
}

// Create print job
Output output = new Output("pdf", "raw", "libreoffice", null, null, null, null);
Hashtable<String, RenderElement> dataTable = new Hashtable<String, RenderElement>();
dataTable.put("data", data);
PrintJob printjob = new PrintJob(dataTable, copServer, output, base64Resource, null, null, null, null);
We loaded the template from a local file and passed in our data element collection and our server object.
Finally we actually send this printjob to a Cloud Office Print server and save the response into our output file:
response = print_job.execute()
response.to_file("output")
(async () => {
    const response = await printJob.execute();
    await response.toFile('output');
})();
(async () => {
    const response = await printJob.execute();
    await response.toFile('output');
})();
printjob.execute().downloadLocally("./downloads/SolarSystem");
The resulting file can now be found in the specified folder.
Result
For the "pptx" output file, we will not add the result in this text, but the output file can be found in the folder of this example. The "docx" output file will look like this:
More Info
For more information about the multiple request merge example for each individual SDK, visit the appropriate pages: